Discover the Current Population Stats of Knoxville
Ever thought about how Knoxville became Tennessee’s third-most-populous city? According to the 2020 US census, its population is 190,740. This puts it right after Nashville and Memphis. It’s also the biggest city in the East Tennessee Grand Division.
Home to the University of Tennessee, Knoxville blends rich Appalachian roots with modern progress. It stands at 886 ft (270 m) above sea level. This unique mix of culture and development is thanks to its location at latitude 35°57′42″N and longitude 83°55′24″W. This strategic spot has attracted people for centuries, from the Cherokee in the 18th century to its founding in 1815.
Key Takeaways
- Knoxville’s population as of the 2020 census is 190,740, ranking it as Tennessee’s third-most-populous city.
- The Knoxville metropolitan area had a population of 879,773 in 2020.
- The city covers a total area of 104.25 sq mi, with 5.4% of it being water.
- Knoxville’s elevation stands at 886 ft above sea level.
- Various tribes, including the Cherokee, had settlements in Knoxville during the 18th century.
- Knoxville served as Tennessee’s capital until 1817 before it was moved to Murfreesboro.
- Knoxville boasts a blend of Appalachian culture and urban development, becoming an essential cultural and economic hub.
Understanding Current Knoxville Demographics
As of 2020, Knoxville’s population hit 190,740, showing steady growth. People are drawn to its economic and cultural opportunities. The city’s mix of ethnicities and wide age range highlight its diverse, lively nature.
Population Count and Growth Trends
Knoxville is getting bigger and better. By 2024, it’s expected to reach 796,000 residents. This growth rate of 1.53% shows its appeal. Back in 2023, the area’s population was 784,000, up 1.69%. We see this increase has been steady in recent years.
Ethnic and Racial Composition
Knoxville’s diversity shines through. Recent figures break down its population by race:
| Race | Population |
|---|---|
| White | 141,791 |
| Black or African American | 30,902 |
| Two or more races | 12,336 |
| Other race | 3,474 |
| Asian | 2,990 |
| Native American | 287 |
| Native Hawaiian or Pacific Islander | 77 |
This mix makes Knoxville’s culture rich and its community lively.
Age and Gender Distribution
In Knoxville, you’ll find people of all ages. The median age is 32.9, with slightly more females than males. Check out how the age groups stack up:
- The percentage of the population aged 75+: 4.4%
- The percentage of the population aged 65-74: 4.0%
- The percentage of the population aged 35-54: 10.0%
- The percentage of the population aged 55-64: 4.7%
- The percentage of the population aged 18-34: 10.4%
This Knoxville age breakdown shows a wide range of ages. It makes Knoxville a great place for everyone, no matter their stage in life.
Analysis of Knoxville Census Data
The Knoxville census data helps us learn about the city’s past population changes and money matters. It shows us how the number of people in Knoxville has changed over time. It also lets us see important money trends in the area.
Historical Population Changes
Knoxville’s population has changed a lot over the years. The U.S. Census Bureau’s numbers from 1980 to 2010 show these changes well. They also track how the area’s population has changed year by year since 1980. By 2018, the number of people in the Knoxville Metro Area was 868,499.

Socioeconomic Indicators
Looking at the money side in Knoxville shows some key points. We get details on income and jobs from data sources. The American Community Survey, done every year from 2009, gives deep information about people, jobs, and homes in Knoxville and Knox County. The University of Tennessee also makes predictions about the future population. They look at how many people will be there, their age, and their race up to 2064.
This helps us see the consistent and changing money map in Knoxville. Here’s a quick look at some old data:
| Year | Population | Median Household Income (Example Tract) | Data Source |
|---|---|---|---|
| 1980 | N/A | N/A | U.S. Census Bureau |
| 1990 | N/A | N/A | U.S. Census Bureau |
| 2000 | N/A | N/A | U.S. Census Bureau |
| 2010 | N/A | N/A | U.S. Census Bureau |
| 2018 | 868,499 | $173,688 | American Community Survey |
Studying Knoxville’s census data is very important. It tells us about the old changes in population and the new financial trends. This information is key for leaders, companies, and the people living there.
Factors Influencing Knoxville Population Growth
Knoxville’s population is growing due to several key reasons. These pull in many people and families wanting to settle down. We will dive into these big influences on population growth.
Economic Development
Knoxville’s strong economy is a key factor behind its population rise. There is growth in tech, health, and education. This has made many jobs available, attracting young pros and families. Knoxville’s growing job market makes it an attractive place to live.
Migration Patterns
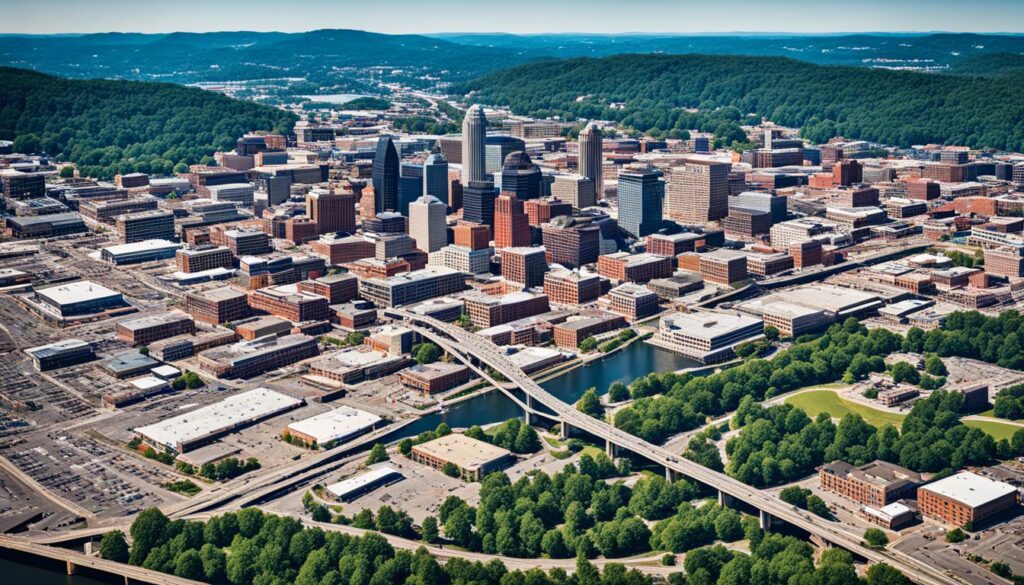
People moving to Knoxville more than those leaving is a key trend. This is seen in the city’s rising resident numbers. Recent data from July 1, 2020, shows Knoxville is a popular place for new residents. It’s doing better than many other cities at drawing in new people.
Birth and Death Rates
Local births outnumber deaths, helping Knoxville grow naturally. The data shows more babies are born than people passing away. This trend is vital for Knoxville’s growing community.
Educational Opportunities
Knoxville’s education scene helps bring in more people. The University of Tennessee and other schools have programs that draw in students and working professionals. With more college grads staying in Knoxville, the city’s economy and appeal grows. More educational chances mean more people are interested in moving here.
Insights into Knoxville Residents’ Lifestyle
Knoxville, Tennessee is a thriving city with about 188,000 residents. It’s known for its different ways of living. People here care about where they live, how much they make, and how they get around.
Housing and Homeownership Rates
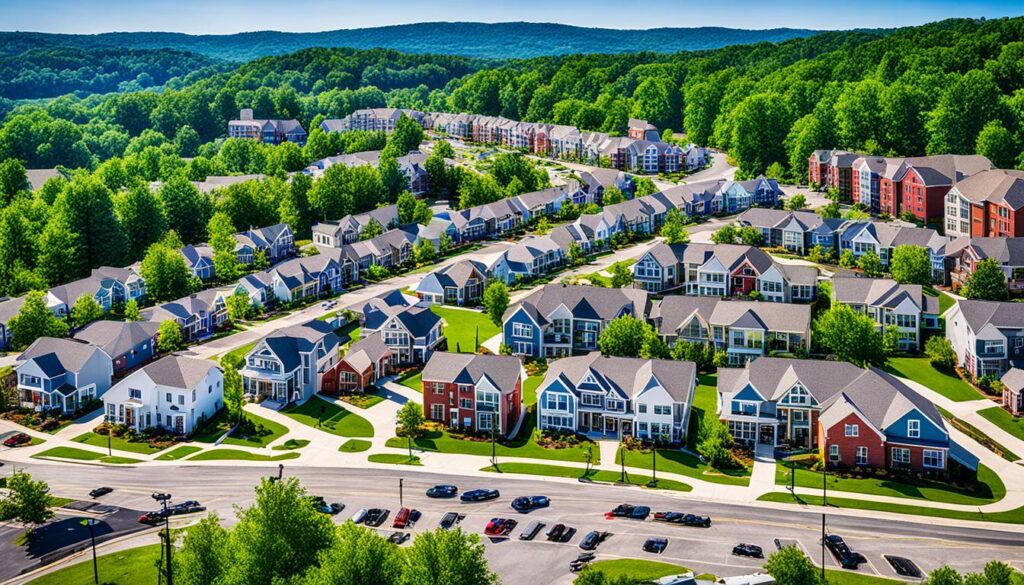
In Knoxville, you’ll find many home options that won’t break the bank. The average home price in Knoxville is $344,900. Homes usually sell in about 42 days. Depending on what you’re looking for, prices for single homes, condos, and townhouses differ:
- Fountain City: $280,000
- Sequoyah Hills: $810,000
- South Knoxville: $292,500
- East Knoxville: $256,000
- West Hills: $517,000
The cost of living in Knoxville is lower than the U.S. average. This makes buying a place more doable for many.
Median Household Income
In Knoxville, the average household earns about $48,309 yearly. This puts Knoxville in a good spot economically. The balance between what people earn and what things cost helps create a pleasant life for most.
Commute Statistics and Transportation
Getting to work in Knoxville usually takes about 20.5 minutes. Most folks drive alone, keeping with the national trend of two cars per home. Walking, using transit, or biking isn’t as easy, though. Knoxville needs to work on making these options better to help everyone get around.
Comparing Knoxville Population with Other Major Cities
In major cities population stats, Knoxville is notable with 189,339 residents. It fits between Columbia and Rochester. Columbia has 137,276 people, and Rochester has 211,100.
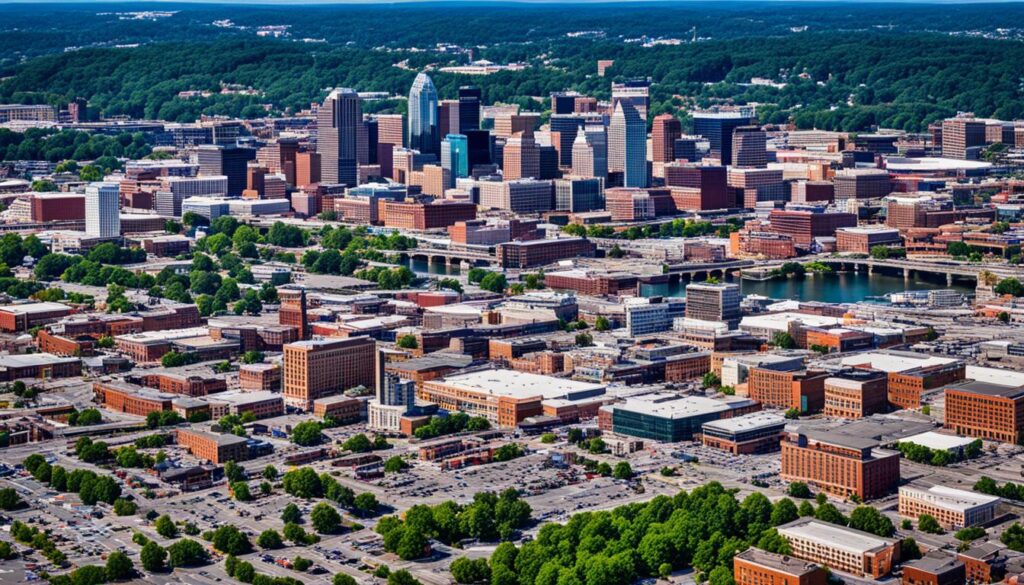
The population comparison shows unique features of Knoxville. For example, it includes a lower population density than Rochester but higher than Columbia. Knoxville has 1,918.1 people per square mile. This is much less than Rochester’s 5,902.3 but more than Columbia’s 1,009.4. Although more women live in Knoxville than in Columbia, it’s just a bit over the U.S. female average.
Knoxville’s population makeup is quite interesting in major cities population stats. It’s mostly White at 72.1%, which is more than Columbia and Rochester. The city’s median age is 33.5 years, younger than the U.S. median of 38.4. It’s also older than Columbia’s and just a bit younger than Rochester’s.
The population comparison also focuses on family aspects in Knoxville. About 36.7% of its people are married, which is higher than Columbia but less than the U.S. average. The city’s average household size is 2.19, similar to Columbia’s yet smaller than Rochester and the U.S. average.
Knoxville’s details point to its distinct place. It offers both city life benefits and a touch of community living. This combination makes it stand out in these major cities population stats.
Conclusion
Knoxville’s population stats show us a lively city with a bright future. The city’s economy is rich, covering areas like manufacturing, healthcare, and tech. This mix makes Knoxville a great place for new and old businesses to thrive. The economy is helped by the city’s good location and its support for business growth.
Education is key for Knoxville’s future. The University of Tennessee is known for its great educational programs. It brings a lot of value to the city. Knoxville also offers a life with less cost than the national average. This is great news for residents. It means they can enjoy life without spending too much.
Knoxville is special for its nature and city life. It’s easy to find fun outdoor activities. The city is close to the Great Smoky Mountains National Park. There, residents can relax and have fun. Knoxville also has a lively food scene and housing is affordable. These have made many people move to Knox County, with 83,000 new residents in 2022. These features make Knoxville a great place to live. Its community is diverse and thriving.

